Episode 168: Is Housing Headed for a Crash? + June SOI Challenge

In Episode 168 of the Wandering But Not Lost Podcast, co-hosts, Jan O’Brien & Matt Emerson discuss the hot real estate topic that is on most homeowner's minds - Is Housing Headed for a Crash? Well, we'll share 5 reasons and graphs/charts to support we don't think so, and we also invite you to take the JUNE SOI CHALLENGE!
Is Housing Headed for a Crash?
Thank you to Keeping Current Matters for providing incredible info for REALTORS! Not familiar with KCM? Please give it a preview ~ http://bit.ly/WBNLTryKCM.
Check out Jan's LinkedIn article as an example of how you can use this info in your social media marketing - Go to LinkedIn.
Why This is Not Like the Last Time (Great Recession)
Epic Low Inventory Coupled with Pent-up Buyer Demand
There are a variety of reasons for the epic low inventory levels we have been experiencing. Here are the top reasons most homeowners have been hesitant to sell, which in turn has resulted in meager inventory:
- COVID-19 pandemic health concerns. With the rollout of vaccines and easing of restrictions nationwide, we should start to see an uptick in the number of homes coming on the market in the second half of this year.
- Recovery of the economy & unemployment concerns. Many people have decided to stay put until they are comfortable with COVID concerns and the impact on the local economy and their jobs/income.
- Mortgage forbearance and tenant evictions have been extended through June. Once these measures expire, we hope to see more homes come on the market from investors deciding to sell and some homeowners cashing out while still having equity.
- Concerns about not being able to find a home to purchase after selling their existing home. Some sellers have elected to maximize their equity now and either rent a home for the next year, buy a new construction home or be competitive for their next purchase.
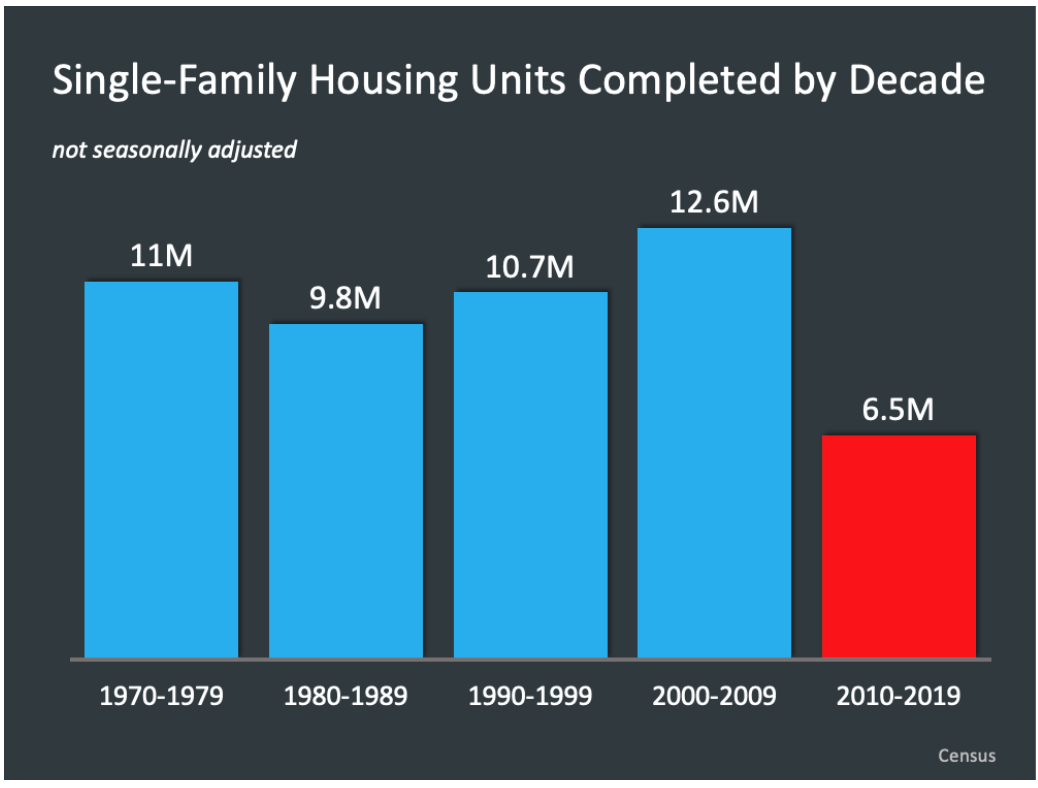
Another factor contributing to the lower inventory levels is a deficit in New Construction Homes.
“The main driver of the housing shortfall has been the long-term decline in the construction of single-family homes. That decline has resulted in the decrease and the supply of entry-level single-family homes or starter homes.” Probably no bigger issue right now that we need to be talking about than the lack of available inventory across the country.”
~ Sam Khater, Freddie Mac
Take a look at the graph below for single-family housing units completed by decade, and you see the deficit over the last decade between 2010 and 2019, where just 6.5 million homes were completed in the country compared to the four previous decades.
Even with a slight rise in the number of houses for sale this spring, inventory remains near an all-time low. 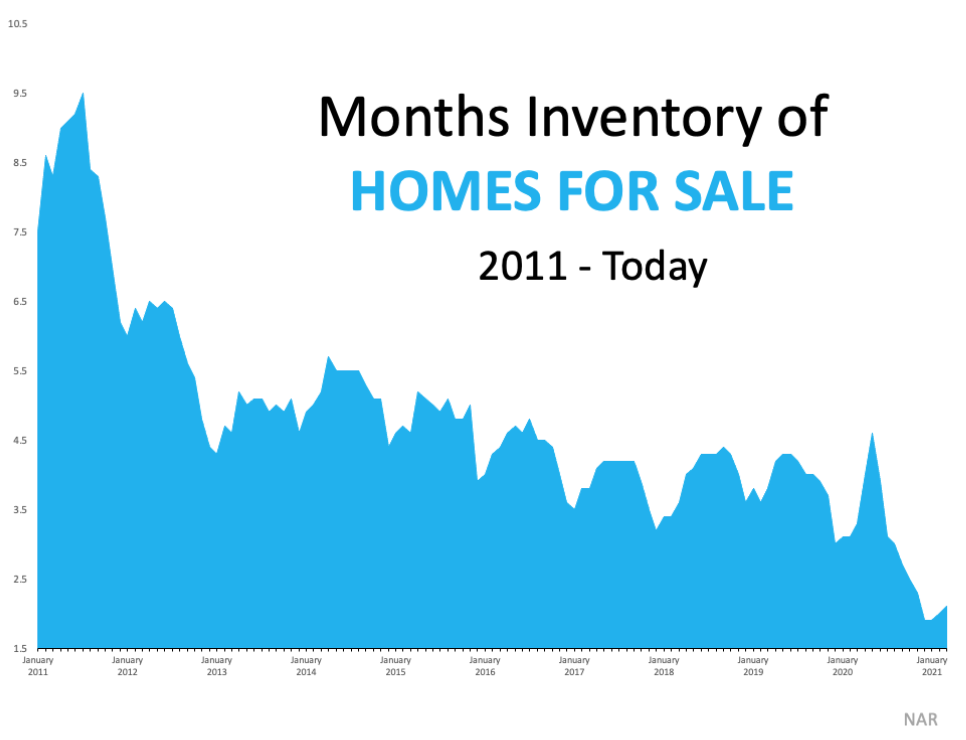
High buyer interest creates a major imbalance between supply and demand, but sellers are beginning to re-enter the market as the small uptick in inventory shows. Selling your house now enables you to take advantage of buyer demand and get the most attention for your house – before more listings come to the market later this year.

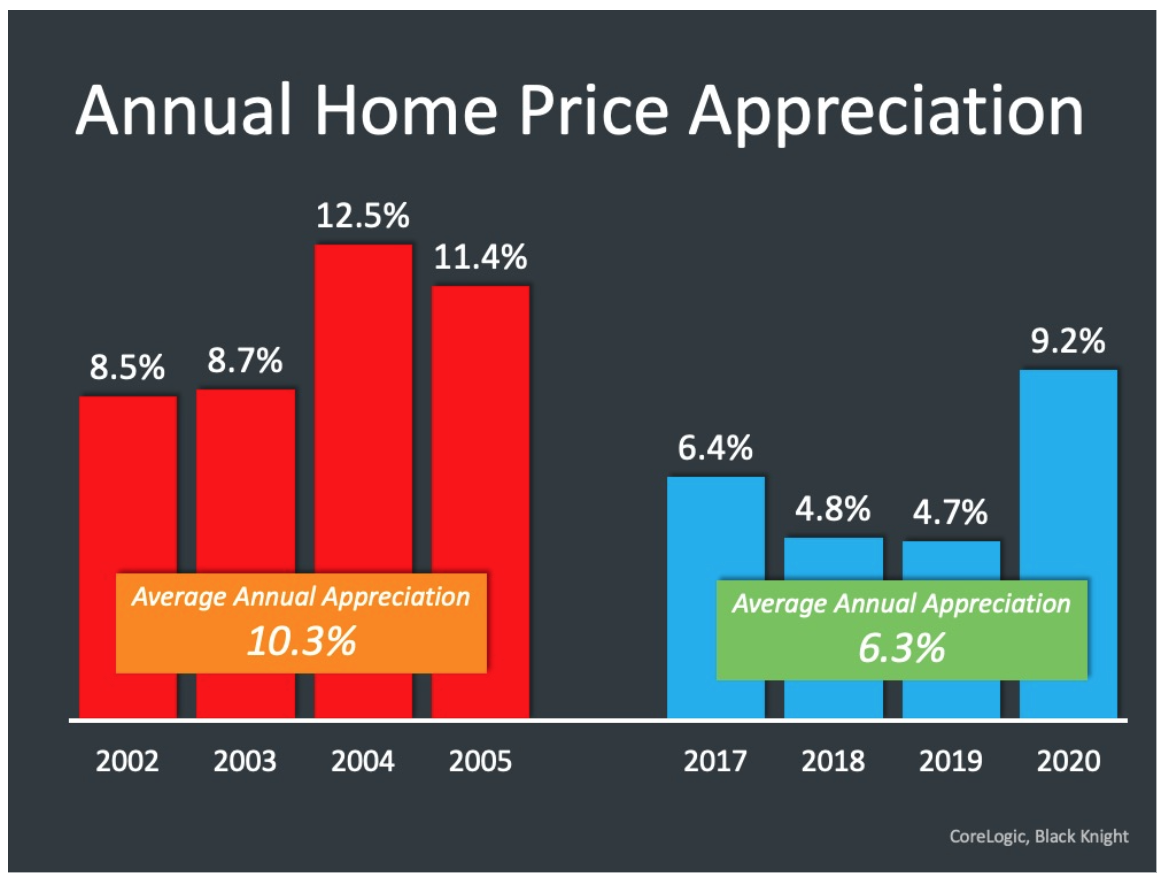
Home Price Appreciation Comparison
In 2020 according to CoreLogic, the average annual appreciation in the nation was 9.2% due to the low inventory caused primarily by the pandemic. In the chart below, you will note that between 2017-2019, annual appreciation was a normal 5-6%. Compare that to the years surrounding the lead up to 2006, and the average annual appreciation was over 10%.
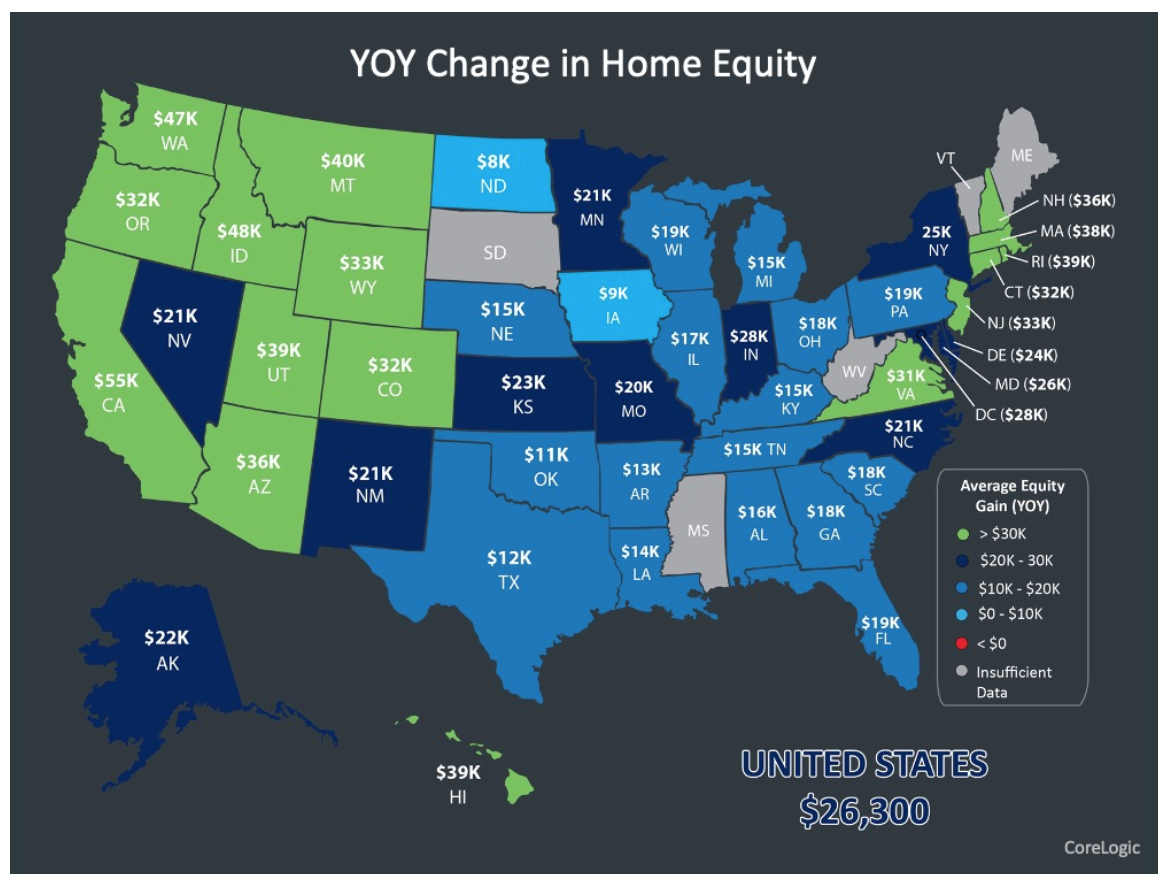
Majority of Homeowners Have Significant Equity
The average gain in a mortgaged home over the last year has been $26,300. The map below shows the significant gain in home equity for each state.
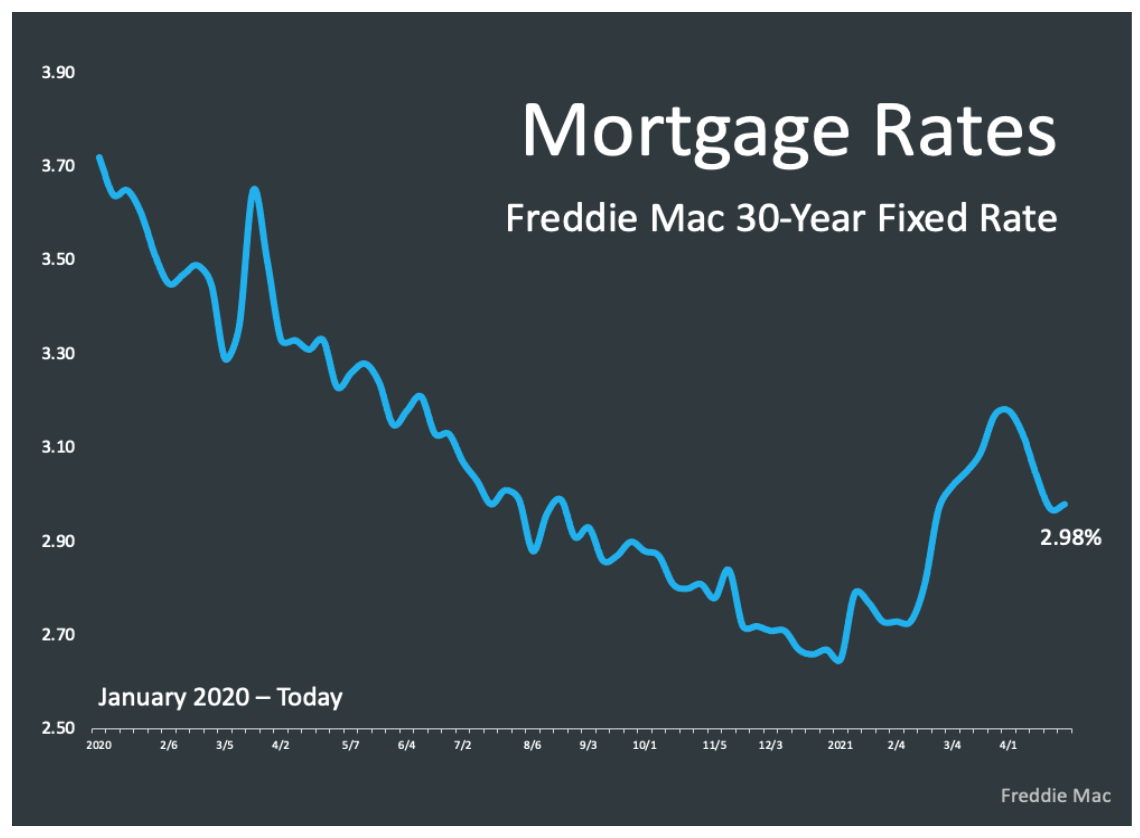
Low Interest Rates

In honor of Jan O'Brien's birthday, we invite you to take a step back in time to Episode 23 of the Wandering But Not Lost Podcast and listen to a birthday celebration LIVE from the Disneyland Resort in June of 2018.
Click HERE for the show notes!
Like what you heard today? We'd love to hear from you. Please take a few minutes and write us a review...
Facebook: http://bit.ly/WBNLFacebookReview
Google: http://bit.ly/3vgrMw1
Apple Podcast: http://bit.ly/WBNLApplePodcastReview


